

Core Web Vitals are three numbers Google uses to judge whether your website is a decent experience. They measure how fast the page looks loaded, how fast it reacts to a tap and how much it jumps around while it loads. Many business owners have never heard of them, yet the numbers are easy to check and hard to argue with.
We ran ours in August. The homepage scored a 12.2 second load on mobile. Google considers anything over 4 seconds poor. So before we explain what these numbers mean, understand that we are writing this as people who just got a bad grade on our own test.
Core Web Vitals measure three things: Largest Contentful Paint, how long until the page looks loaded. Interaction to Next Paint, how long until it reacts to a tap. And Cumulative Layout Shift, how much the page moves around while it loads. Not speed in general. Three specific moments in the life of a page load.
Largest Contentful Paint measures how long it takes for the biggest thing on screen to appear. Usually that is your hero image or your headline. Google wants this under 2.5 seconds. Under 4 seconds is a warning. Over 4 seconds is a fail.
This is the one that matters most, because it is the closest match to what a visitor feels. They tapped your link. How long did they stare at nothing?
Interaction to Next Paint measures the delay between someone clicking and something happening. Tap a menu, open a dropdown, hit a button. Google wants that response under 200 milliseconds. Anything over half a second feels broken.
A page can paint fast and still fail here. If your site loads in two seconds but the menu does nothing for a full second after someone taps it, they will tap again, then leave.
Cumulative Layout Shift measures content moving after it has already rendered. You go to tap a link, an ad loads above it, the link slides down, and you tap the wrong thing. Google wants this under 0.1.
Ours is zero across every page. That is the one we did not have to fix.

The three Core Web Vitals. Load, response, and stability.
Our homepage failed. Mobile Largest Contentful Paint came back at 12.2 seconds against a 2.5 second target, with a 6.5 second first paint and a performance score of 56 out of 100. The web design page was 10.1 seconds and the blog was 8.3. Desktop passed at 2.5 seconds, which is exactly how a site this slow goes unnoticed.
That is the trap. Most business owners check their site on the laptop sitting in front of them, see it load instantly, and assume it is fine. Many of your visitors are on a phone on a mobile connection, and that is the number Google grades you on. Our tips for better mobile website design cover the rest of the phone experience.
One more thing showed up. Google had no real user data for our site at all. It reports field data from actual Chrome visitors when a site gets enough traffic, and ours does not yet. When you are small, slow pages and low traffic feed each other.
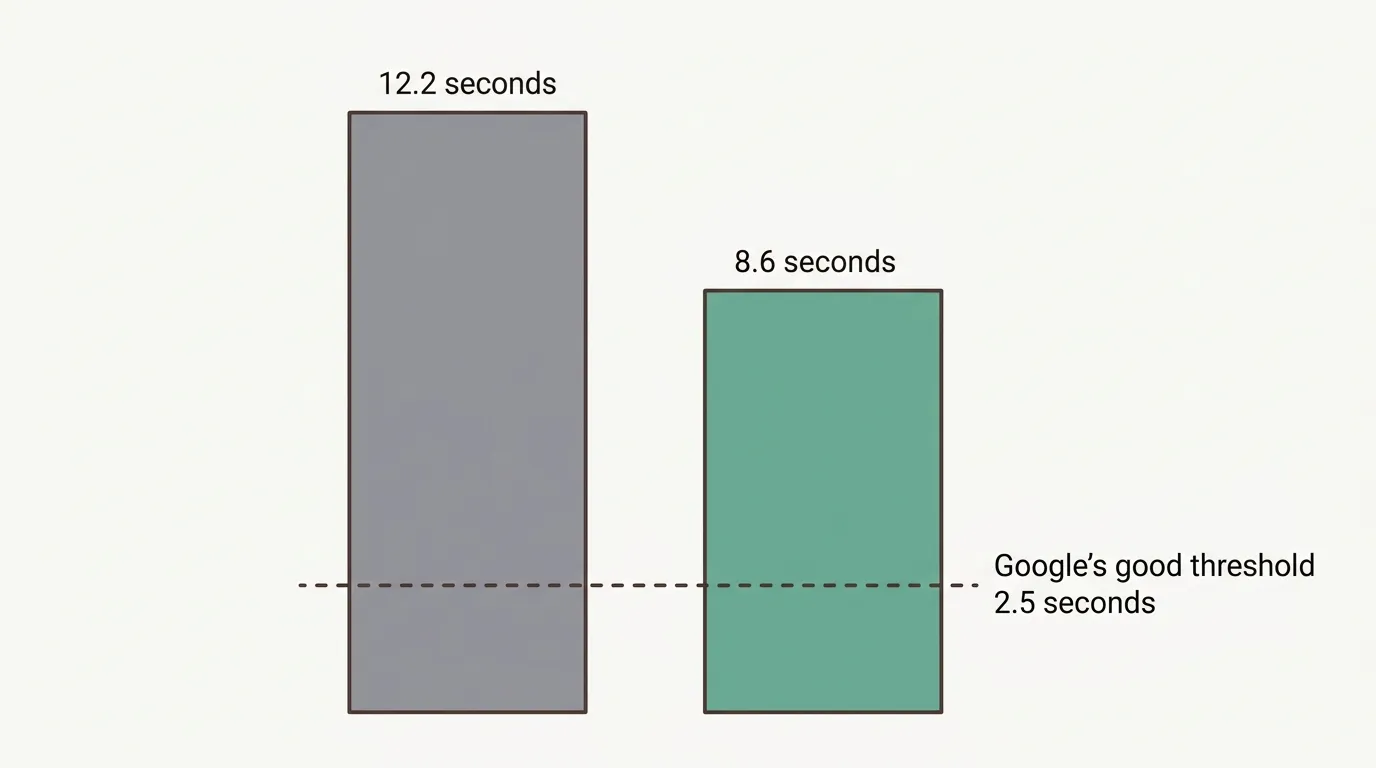
Our homepage mobile LCP before and after. Better, still not good.
One setting did most of it. Turning on asynchronous JavaScript loading, so scripts stop blocking the browser from drawing the page, cut mobile Largest Contentful Paint from 12.2 seconds to 8.6. That is 3.6 seconds from a single toggle, before we touched a single image.
When a browser hits a script tag in the head, it stops. It will not draw anything until that script finishes downloading and running. Our homepage was losing 1,410 milliseconds to this. The web design page was losing 2,060.
The fix was a single toggle in our hosting settings that tells the browser to load JavaScript without blocking the page. Mobile LCP went from 12.2 seconds to 8.6. First paint went from 6.5 to 4.0. Desktop blocking time dropped from 220 milliseconds to 140.
We tested it on a staging copy first, because that toggle can break custom code. Our quote form runs on jQuery and we needed to know it still worked before anyone saw it. It did.
The four images in this article started as PNG files totaling 5.9 megabytes. Converted to WebP they came to 204 kilobytes. Same images, 96 percent smaller, and you cannot tell the difference on a screen.
We ran the same conversion across the site earlier and cut about 940 kilobytes off pages people actually visit. One image alone went from 594 kilobytes to 14.
Blocking time went up, from 170 milliseconds to 230 on mobile. That is the tradeoff. Loading scripts without blocking means the work happens later instead of earlier, so the main thread gets busier once the page appears. We took that trade because a visitor staring at a white screen for 12 seconds is a worse problem than a slightly busy thread at second nine.
We are also not finished. 8.6 seconds is still bad. Good is 2.5.
When you run a speed test you get lab data. A simulated phone on a simulated slow connection, loading your page once. It is repeatable and it is useful for finding what is broken. It is not what Google ranks you on.
Field data is what real Chrome users experienced on your site over the last 28 days. It is a different view from the visitor data in Google Analytics. Google collects it through the Chrome User Experience Report and it only appears once enough people have visited. That is the number that feeds page experience.
Our site has no field data. Not enough visitors. So we are working off lab numbers, which is the right move when you are small, because lab data tells you what to fix and field data only tells you whether it worked. If you have never checked, run the test and look for the line that says no data available. It is not an error. It means you are not getting enough traffic yet, and slow pages are part of why.
One more thing that confuses people. Run the same page twice and you will get two different scores. Five or ten points of movement between runs is normal. Chase the trend across three runs, not one number.
Five things cause almost every slow Largest Contentful Paint: scripts that block the browser from drawing, an oversized hero image, custom fonts that hide text while they download, a slow server response, and simple accumulation of widgets nobody removed. They show up roughly in that order.
The browser reads your page top to bottom. When it hits a script tag it stops everything and waits. Analytics, chat widgets, review widgets, font loaders, A/B testing tools. Each one is a pause before anything appears. This was our whole problem, and it is a common one.
Your hero is usually the largest element on screen, which means it is usually what LCP is timing. A 2 megabyte photo on a mobile connection is several seconds by itself. The fix is boring: resize it to the size it actually displays at, convert it to WebP or AVIF, and never lazy-load the one image that is visible when the page opens.
Custom fonts download separately from the page. By default many browsers hide the text until the font arrives. Your headline exists, it is just invisible, and LCP keeps counting. One CSS line, font-display swap, tells the browser to show the text immediately in a fallback font and swap when ready.
If your host takes 800 milliseconds to send the first byte, you have lost 800 milliseconds before the browser has done anything. Shared hosting and heavy plugin stacks are the usual cause. On managed platforms this is rarely the problem.
Every widget, embed, tracking pixel, and animation costs something. Most sites accumulate these over years and nobody removes any of them. We found a review widget on this site that had been disabled by its vendor months ago. It still loaded its script on every page and rendered nothing.
You tap the menu and nothing happens for half a second. You tap a filter on a product list and the page freezes. You start typing in a form and the letters appear late.
The cause is almost always JavaScript doing too much work on the main thread at the moment you interact. Sliders, animation libraries, filtering scripts, and chat widgets are common offenders. Google wants this under 200 milliseconds.
Small business sites usually pass INP by accident, because they are simple. If yours fails, look at whatever runs on scroll or on click first.
You go to tap a button and the page shifts, so you tap an ad instead. That is layout shift, and it is measured on how much moved and how far.
Three causes cover most of it. Images without width and height set, so the browser does not reserve space until the file arrives. Fonts that swap and change the height of a paragraph. Anything injected above existing content after load, like a cookie banner or a promo bar.
Ours is zero. That is not skill, it is the platform reserving space for images automatically. If you are on WordPress with a page builder, check this one first.
Fix render blocking first. It is one setting on most platforms and it carries the largest single gain. Then compress your images, then add font-display swap, then set image dimensions, then delete what you are not using. That order runs cheapest to most expensive.
Start with render blocking. If your platform has a setting to load JavaScript without blocking, test it on a staging copy and turn it on. That single change moved our LCP 3.6 seconds. Test first, because it can break custom scripts.
Then compress your images. Convert to WebP, size them to what they actually display at, and lazy-load everything except the hero. The four images in this article went from 5.9 megabytes to 204 kilobytes.
Then add font-display swap. One line.
Then set explicit width and height on every image. This protects CLS and costs nothing.
Then remove what you are not using. Dead widgets, old tracking pixels, plugins nobody has opened in two years. This is the least glamorous item and often the most effective.
Only after all of that should anyone talk to you about rewriting code or changing hosts.
Some, but less than people selling platforms will tell you.
WordPress can be fast. Most WordPress sites are not, because plugins stack up and each one adds scripts nobody audits. If you are on WordPress and your numbers are bad, your problem is usually the plugin list, not WordPress.
Some website platforms handle image sizing and hosting for you, so a few of these problems never appear. We still check this on every site we build. It is not automatic. Our own site scored a 56 on mobile until we went and looked. Any platform will let you build something slow.
Squarespace and Wix are heavier by default and give you fewer levers. You can improve them. You cannot rebuild them.
The work above is a day or two for most small business sites. Render blocking and image compression are usually a few hours combined and they carry most of the gain.
Whether it is worth paying for depends on what your site does for you. If you get leads through it, a page that takes 8 seconds on a phone is losing you people who never call and never show up in any report. If your site is a brochure nobody visits, fix the traffic problem first with local SEO and come back to speed.
We would rather tell you that than sell you a speed audit you do not need.

Most of the win came from one setting, found by reading the waterfall.
Go to pagespeed.web.dev, paste your homepage, and run it on mobile. Not desktop. Mobile.
Look at three lines. Largest Contentful Paint tells you whether people are waiting. Cumulative Layout Shift tells you whether your page jumps. Interaction to Next Paint tells you whether it responds. Then scroll to the diagnostics and find the largest number of milliseconds next to any single item. That is your first job.
Run your three most important pages, not just the home page. Ours varied by four seconds between pages, and the page we sell from was the second worst.
The remaining work on our own site is unused JavaScript, about 212 kilobytes of it, unused CSS at roughly 70 kilobytes, cache settings, and 33 animations that force the browser to recalculate layout while it draws. None of that is glamorous. All of it is measurable.
We will publish the numbers again when we get there, including the ones that do not improve.
Yes, but they are a tiebreaker, not a trump card. Google has said page experience is a ranking signal. It will not lift a thin page above a genuinely better one. Where it can decide things is between two pages that are otherwise close, which happens often in local search.
Yes. Google grades mobile. Your office wifi and your desktop browser cache are hiding the problem from you, not solving it.
The lab scores update the moment you republish. The real user data Google collects takes about 28 days to catch up, because it is a rolling average of actual visits. Fix it today, expect Search Console to agree with you next month.
Google's published thresholds are 2.5 seconds or less for Largest Contentful Paint, 200 milliseconds or less for Interaction to Next Paint, and 0.1 or less for Cumulative Layout Shift, measured at the 75th percentile of your visitors (Google, web.dev). Hitting all three is a pass. Missing one is a fail for the whole set.
Search Console has a Core Web Vitals report under the Experience section. It only shows data once Google has collected enough real visits to your site, and it groups similar pages together rather than listing every URL. If the report is empty, that is the same signal as no field data in the speed test. Use the speed test until Search Console has something to show you.
Skratch Creative is a web design and SEO company in The Woodlands, Texas, and we work with businesses across Spring, Conroe, Magnolia and Tomball. The numbers in this article are from our own site, measured in August 2026, not from a case study we borrowed.
Core Web Vitals are three numbers that tell you whether your website respects a visitor's time. Ours did not. We found the biggest one, fixed it, cut the wait by more than three seconds, and we still have work left.
If you want to know where your site stands, run it yourself with the tool above. If the number comes back ugly and you would rather someone else deal with it, call us at (281) 400-6893 or send us a message. We will run it, tell you what is costing you the most, and be straight about whether it is worth paying anyone to fix.
LATEST POSTS